The relative strength index (RSI) is one of the most effective trading tools that can provide numerous signals. It’s simple in signal interpretation and doesn’t require specific parameters for applying it on a price chart. Therefore, traders prefer it over other technical instruments.
RSI: Basics
The relative strength index is a momentum oscillator. Momentum indicators are used to evaluate a price’s strength. Thus, RSI measures the rate of a price’s rise and fall. Therefore, it looks like a line that fluctuates from 0 to 100. Below, you will find how to read the indicator’s movements.
The index was created by J. Welles Wilder Jr. and initially appeared in his book “New Concepts in Technical Trading Systems.”
RSI: Settings
A significant advantage of the RSI indicator is that it’s a standard technical tool available on all trading platforms. It means that you don’t need to download and implement it separately.
The index is calculated based on two parameters – length and price.
- A length stands for the number of candlesticks calculated to define the RSI average value. The 14 period is set by default. This means that 14 last candlesticks will be considered for the RSI measurement.
- Price type. RSI can be calculated based on closing, opening, high, or low prices. By default, the index uses the closing price.
Many traders prefer the RSI oscillator because it’s effective on any timeframe, even with standard parameters. Still, some strategies will require setting changes. If you use the index for short-term trades, you can change the period to 9. For longer-term positions, you better use a period of 25. Keep in mind that smaller periods will result in more significant RSI fluctuations.
RSI: Applications
RSI appears below a price chart like MACD, Awesome Oscillator, and Stochastic Oscillator. As it was mentioned above, its line fluctuates within a 0-100 range. However, not all numbers are essential for reading RSI’s signals.
Overbought/Oversold Areas
The most important RSI numbers are 70 and 30. When the indicator breaks above the 70 level, it’s a sign that the asset is overbought. Thus, its rate may decline soon. If the index falls below the 30 level, it’s an alarm that the asset is oversold. Therefore, you can expect it to appreciate soon.

Tip: Many traders make this mistake – they open a sell position as soon as the RSI is in the overbought zone and a buy position when the RSI breaks below the 30 level. If you backtest this approach, you will see that the index may stay in any of the zones for a while. Therefore, you risk losing your funds and reaching a margin call so that your trade will be closed automatically. You should open a trade only when the indicator leaves an overbought or an oversold area.
Divergence
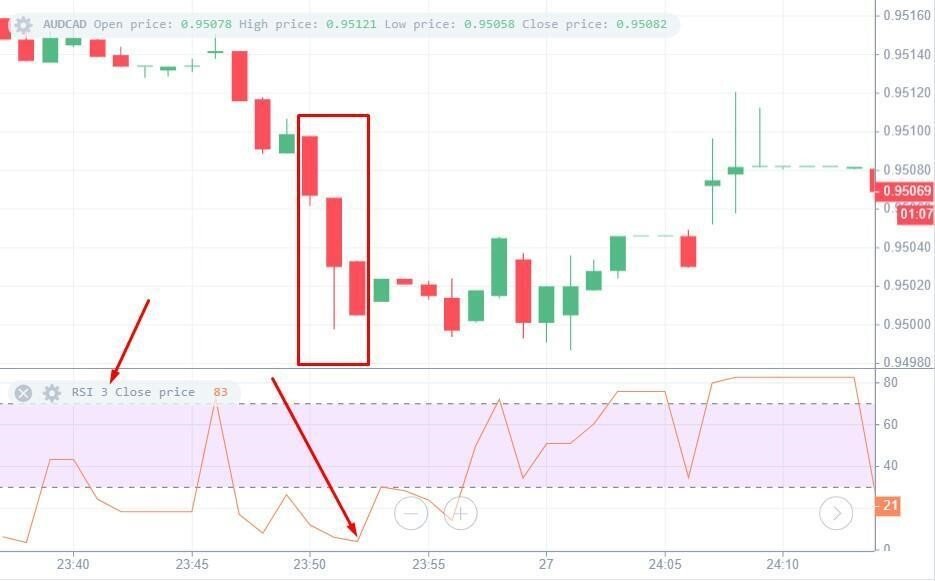
Another opportunity to define a market reversal is a divergence between the price chart and the indicator. If RSI forms a lower high while the price increases, it’s a bearish divergence. You can expect the price to decline soon. Vice versa, when the RSI forms a higher high but the asset’s price doesn’t follow it, it’s a signal the asset will grow in value soon.
Similar rules can be applied when you compare the lows of the price and oscillator. When there is a lower low on the chart, but RSI forms a higher low, the price will unlikely keep falling. A bullish movement is expected to end soon when the indicator has a lower low, but the price moves up.
Meanwhile, you can use this approach when trading with MACD, Stochastic, and Awesome Oscillator indicators.
RSI: Other Indicators
When using any indicator, you shouldn’t fully rely on its signals. Combine two or three indicators or an indicator and a pattern to confirm price movements.
When using RSI, you shouldn’t get a confirmation from other momentum indicators because it’s more likely the signals will be similar. Same signals may create an illusion that they are so strong that you should rely on them. However, it’s a big mistake that can lead to losses.
Apply indicators of different types (momentum, trend, and volatility). For example, you can combine the RSI momentum indicator and the ADX trend tool. RSI signals a price reversal while ADX shows the strength of the current trade.
You can also confirm signals of reversal chart patterns with the RSI indicator.
Final Thoughts
The Relative Strength Index is a vital technical tool. It’s easy to implement it on the chart and read its signals. Moreover, RSI signals are very reliable. If you are experienced enough, you can change its settings and apply it to various strategies. If you are a newbie trader, use its standard settings, so you don’t make a wrong trading decision.


